
Much has been made of the fact that older British people proved much more likely to vote to leave the EU last Thursday, than did young ones. This blog tries to provide some insight into the relationship between age and values in the UK population (thanks to Pat Dade at CDSM for providing data *updated 1810 27 June).
What Happened ?
Lord Ashcroft’s hugely detailed polling on Brexit found (graphic below) that 73% of those aged 18-24 voted to Remain in the EU, whereas 60% of those aged 65 or more, voted to leave.
Given the ageing profile of Britain’s population, this had a huge affect on the outcome. And given the fact that younger people will have to live much longer with the outcome – widely predicted to include poorer job prospects – and the fact that Britain’s old have already left the young saddled with much debt and under-funded pensions and public services, it has caused despair and anger among many people.

Values Differences
I have discussed Brexit in previous blogs (see Brexit Campaigns and the Brexit Values Battle) and there was clear evidence from existing values surveys that pro-and anti-EU attitudes strongly divided along values lines. Settlers and Golden Dreamer Prospectors skewed strongly against the EU (below).
The same people also were much more positive to UKIP, Britain’s anti-EU political party (and similar values skews for similar nationalistic parties exist in France, Italy and Germany – see Brexit Values Battle blog).

The UK Pioneers (bottom right third) agreed the EU was a benefit far more than the Settlers (top), and the Prospectors (left) were split, with the Settler-like Golden Dreamers much less positive than the more Pioneer-like Now People. Note that 43% is close to the 48% who eventually voted for “Remain”. 2015 data.
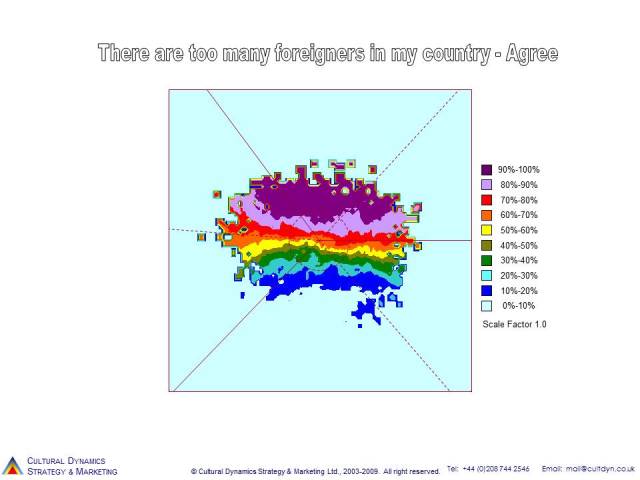
Settlers and Golden Dreamers are also far more likely to agree ‘there are too many foreigners in my country’, a theme – immigration – which most commentators believe played a decisive role in the referendum.
There is also a strong correlation between the values of UKIP voters (and of course some others) and the core readership of newspapers which supported a Leave vote. The Sun and the Daily Mail for example were both pro Brexit.
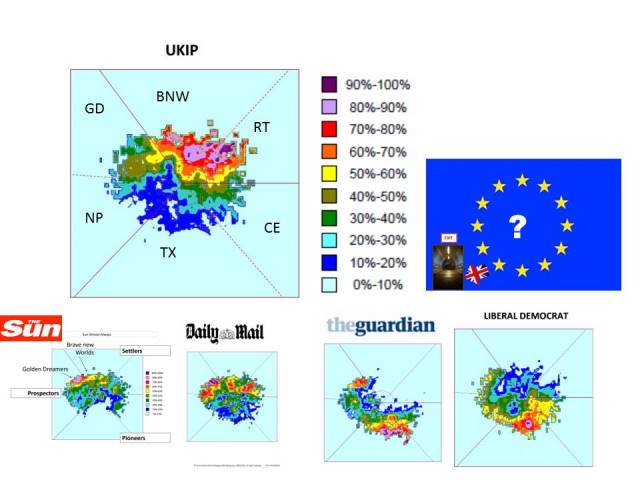
In contrast The Guardian newspaper was a pro Remain voice, as were the Liberal Democrats, who have now announced they will run at the next General Election on re-join-the-EU ticket. Both have a Pioneer dominated base.
All this suggested that a referendum would cause a values split and I think it is certain that this happened. CDSM, the company which runs the values surveys, plans a follow-up values and Brexit survey which will provide some data but the age-skews in the ‘Brexit’ voting behaviour measured by Ashcroft, are also consistent with just such a values divide.
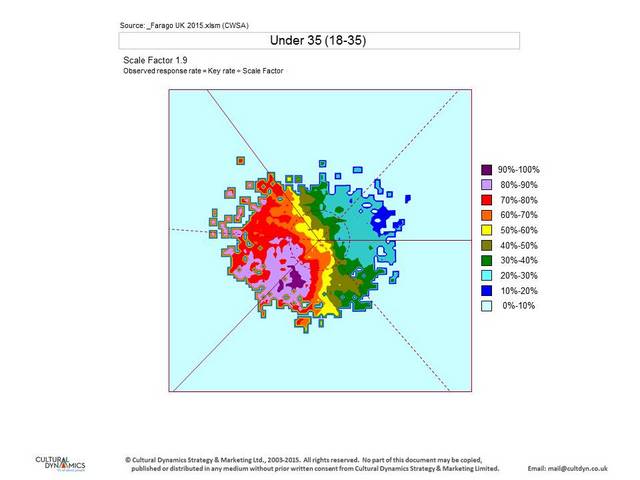
Here are some values-age maps from the UK (December 2015):

The 18-25 year olds are much more likely than by chance to be the Now People Prospectors and Transcender Pioneers.

In contrast the over 65s are over-represented amongst the Roots Settlers and the Concerned Ethical Pioneers (many but not all of the latter will have voted to Remain).

Above and below, the over 55 – 65s and the 45 – 55s are over represented amongst the Settlers and some Pioneers, not the Prospectors.


The values data also supports the idea (compare these maps to the pro/anti EU one above) that people in work (huge skew to Prospector) are more pro-EU than those not in work (ie the retired and unemployed).


Ashcroft reports:
A majority of those working full-time or part-time voted to remain in the EU; most of those not working voted to leave. More than half of those retired on a private pension voted to leave, as did two thirds of those retired on a state pension.
Ashcroft also points out that the Brexit vote age skew was only at its’ most extreme between the youngest and oldest age groups: it ran across the age classes as a trend.
“The older the voters, the more likely they were to have voted to leave the EU. Nearly three quarters (73%) of 18 to 24 year-olds voted to remain, falling to under two thirds (62%) among 35-44s. A majority of those aged over 45 voted to leave, rising to 60% of those aged 65 or over. Most people with children aged ten or under voted to remain; most of those with children aged 11 or older voted to leave“.
Values-Age Data from December 2015
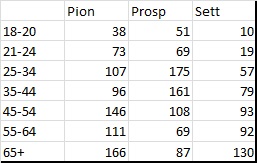
The maps above are produced from the data collected in a December 2015 UK values survey. Here are the data in table form (at Maslow Group level – the data is also broken out at the 12 Values Mode level but that is not shown here).
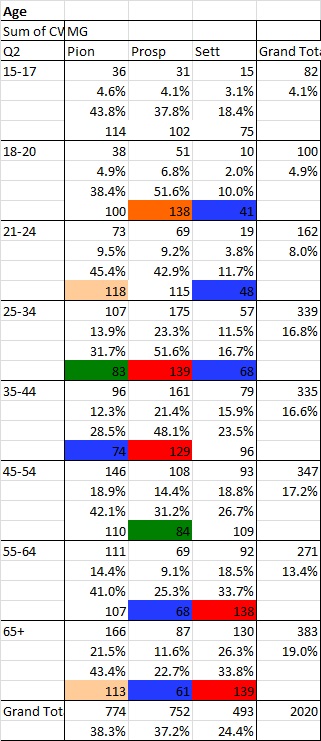
The above table shows the survey of 2020 adults nationally representative by age and sex, broken out by age. There are four rows in each ‘break’ for each column (Pioneer, Prospector, Settler). The first is the number from the sample, the second is the percentage of each column (eg Pioneer) within that break, the third is the proportion of that break across the three columns, and the fourth is the ‘index’ indicating whether this result statistically significant (ie different from the expected average/ by chance, in this case indicating whether there is a significant values-age skew). The index colours are explained below:

So for example in the over 65 age bracket there were 166 Pioneers in the sample, 87 Prospectors and 130 Settlers. 21.5% of the Pioneers, 11.6% of the Prospectors and 26.3% of the Settlers were this age. 43.4% of all the 65+ year olds were Pioneers, 22.7% were Prospectors and 33.8% were Settlers. The ‘indexes’ were 113 Pioneers (more than expected as an average of 100 and significant at 95%), 61 for Prospectors (significant at 99% and under represented) and 139 for Settlers (significant at 99% and over represented). This takes into account the different sizes of the values groups in the population.
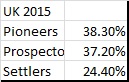
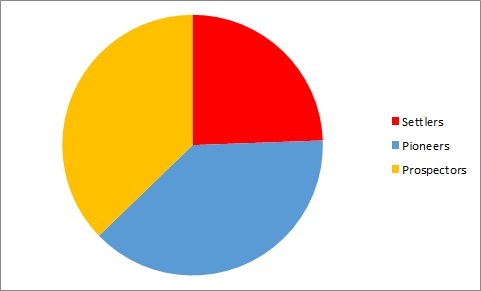
Overall sizes of Maslow Groups in UK population in December 2015:
Looking at the colours up and down the table however you can see that there is a clear trend:
The Prospectors are over represented in younger age classes under 44 except average from 21 – 24 and significantly under-represented in all the over 54s. The Settlers show the opposite trend. In the 18 – 20s they are indexed at 41, which means there are 59% fewer of them than if the Settlers were randomly present across the age classes. (The reasons for this will be due to life experiences of the people affecting what their unmet needs currently are, and the way this has/not taken place across different cohorts). There are 39% more of them than ‘average’ in the over 65s.
The Pioneers show very less age correlation but are over indexed at 21-24 and in the large over 65 group. A disproportionate number of these Pioneers are Concerned Ethicals (index 194). If it’s the case that some of these older Pioneers voted for Brexit, it’s likely that they did so because they had some sort of ‘ethical’ objection to the EU (think the sort of anti-corporate reasoning that Jeremy Corbyn or some of his supporters might put forward for example). Other possible Pioneer reasons for voting against the EU might include libertarianism but we know from the EU question above that the mass of Pioneer feeling about the EU was ‘pro’. Pioneer reasons for voting Brexit would have been very different from Settler reasons.
So overall it seems likely that the Settlers will have voted most solidly for Brexit, and that the ‘immigration question’ and fear of foreigners will have swung many of them.
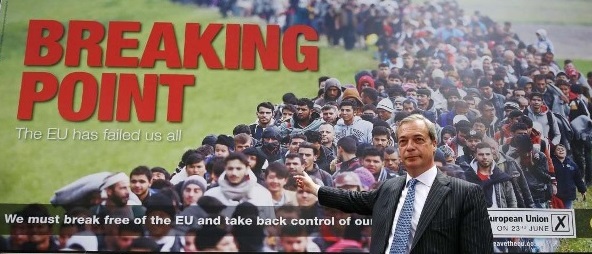
UKIP leader Nigel Farage with his controversial referendum campaign poster showing people trying to enter the EU and widely understood to be an anti-immigration statement.
The apparently simple nature of the referendum choice would itself resonate with Settlers’s self-declared belief that the world is ‘really a simpler place than it’s made out to be’ (one of hundreds of Attributes measured in the values survey), while the Leave campaign’s slogans about ‘give us our country back’, appealed both to nationalism, and a fear of losing identity to ‘too many foreigners’.

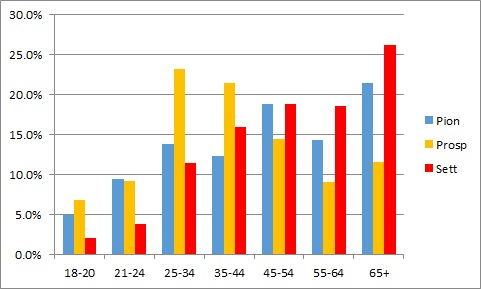
Above: proportion of each age class made up by Settlers (red), Prospectors (yellow) and Pioneers (blue), with the column height showing actual size of sample. (Under 18s not shown as they were not allowed to vote in the referendum).

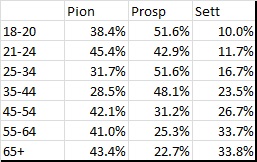
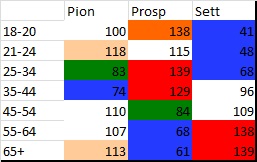
Above: diagram and table show the proportion within each age class, in each Maslow Group (sum to 100 across rows). The Settlers are proportionately greater in the UK population in the older age classes.
Below: the percentage of each Maslow Group in each age class (age distributions of MGs).


above % of MGs in over 65s (as a group the over 65s are 19% of the total)
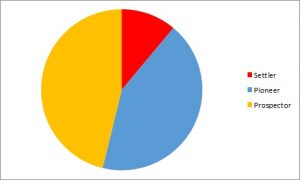
above % of MGs in 18 – 24s (as a group the 18 – 24s are 12.9% of the sample)
It can also be noted that Ashcroft’s polling showed that many people decided how to vote well before the Referendum date. The 36-39% who ‘always knew’ and so presumably voted irrespective of what was said during the campaign, are very likely to have voted according to values, and the majority had already decided by about the time of the CDSM values survey cited above.

This may also have played some part in the anecdotal reports of people who placed early postal votes and then regretted their decision later. 38% told Ashcroft that they had voted by post, a figure rising to 48% among the over 65s.
Ashcroft reported:
Nearly half (49%) of leave voters said the biggest single reason for wanting to leave the EU was “the principle that decisions about the UK should be taken in the UK”. One third (33%) said the main reason was that leaving “offered the best chance for the UK to regain control over immigration and its own borders.” Just over one in eight (13%) said remaining would mean having no choice “about how the EU expanded its membership or its powers in the years ahead.” Only just over one in twenty (6%) said their main reason was that “when it comes to trade and the economy, the UK would benefit more from being outside the EU than from being part of it.”
and
For remain voters, the single most important reason for their decision was that “the risks of voting to leave the EU looked too great when it came to things like the economy, jobs and prices” (43%). Just over three in ten (31%) reasoned that remaining would mean the UK having “the best of both worlds”, having access to the EU single market without Schengen or the euro. Just under one in five (17%) said their main reason was that the UK would “become more isolated from its friends and neighbours”, and fewer than one in ten (9%) said it was “a strong attachment to the EU and its shared history, culture and traditions.”
Ashcroft also asked a number of questions about social attitudes (below): were these factors a ‘force for good’ or ‘ill’ ?.

Many of these are close to some of the Attributes measured in the CDSM values surveys. For example the responses on immigration, multiculturalism, social liberalism and ‘the green movement’. For me these all reinforce the impression that any subsequent values analysis will show that the Golden Dreamers and Settlers swung most strongly to vote Leave, and the Pioneers and Now People to Remain.
Read a summary of Ashcroft’s findings and download his full report here. Read more about CDSM’s values surveys here.
I’ll post a subsequent blog about what might happen next in the post-EU referendum story and what it might mean for campaigners in the UK.
*Note: the tables and diagrams in the second half of this post were updated at 1810 on 27 June as they were based on an incorrect data set received from CDSM but the maps in the first half were correct and the logic and narrative was also correct. Pie diagrams of the 18 – 24 segment and over 65 segment were also added.


Pingback: Identity Factors and Values in Britain: A Survey | Three Worlds